Issues with Applying Net Promoter Score (NPS)
Estela Young

全文共 3495字,阅读需 15 分钟 1 Why We Need Experience Metrics In one sentence: user experience is the subjective feeling users have while using a product; the hallmark of subjectivity is “a...

全文共 3495字,阅读需 15 分钟
1 Why We Need Experience Metrics
In one sentence: user experience is the subjective feeling users have while using a product; the hallmark of subjectivity is “a thousand readers, a thousand Hamlets.” From a business perspective, however, we need to quantify those subjective feelings to monitor them better and drive improvements, which is why experience metrics are necessary.
For a more detailed explanation, see the quotation from Experience Measurement Theory 2019:
When it comes to usage experience, everyone thinks it’s very subjective and emotional—a thousand people each have their own Hamlet, and each defines “experience” differently. Some say “as long as it works, UI doesn’t matter; a few extra clicks or a few dozen seconds is fine.” Others argue a product must be easy to pick up with no learning curve, quickly find the needed features, and have a passable UI. Still others claim that everything—from icons to layout—must be clear and intuitive, with operations so simple they feel natural; even if users make mistakes, the system should recover them. When these people gather to evaluate the same product, disagreements are inevitable, and no one can convince anyone else, leading to a stalemate. Metrics, on the other hand, stand on an objective, rational footing, establishing a unified standard to assess a product’s usage experience.
2 What Is Net Promoter Score (NPS)
According to Baidu Baike, Net Promoter Score (NPS) – also called “word‑of‑mouth” – is an index that measures how likely a customer is to recommend a company or service to others. It is the most popular metric for analyzing customer loyalty, focusing on how word‑of‑mouth influences business growth. By closely tracking NPS, companies can become more successful.
NPS was first introduced by Frederick Reichheld, the founder of the customer‑loyalty practice at Bain & Company, in a 2003 Harvard Business Review article titled “One Number You Need to Grow.” It later appeared in his book The Ultimate Question: Driving Good Profits and True Growth.
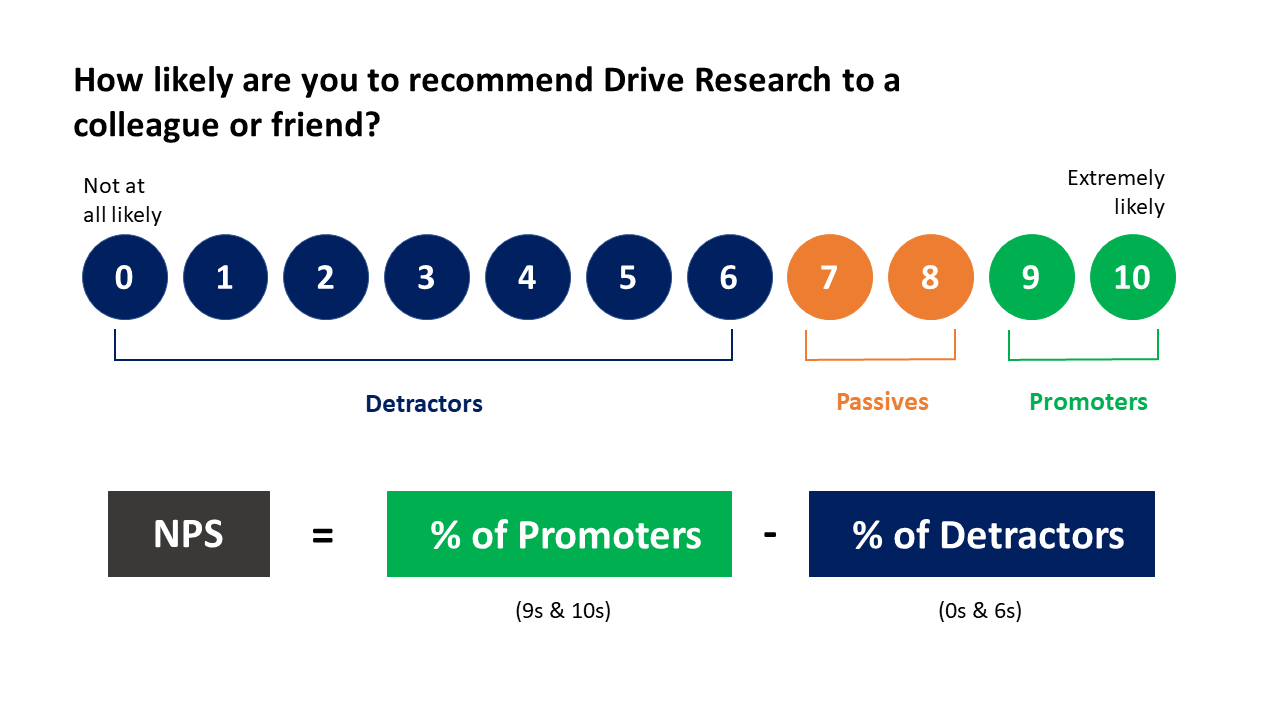
In practice, NPS data come from asking users (in a survey) the question: “How likely are you to recommend our product to a colleague/friend/family member?” Users score from 0–10 (some surveys use 1–10), where 10 means “extremely likely” and 1 means “not at all likely.” Based on the score, respondents are classified as Promoters, Passives, or Detractors.
Net Promoter Score = % of Promoters – % of Detractors
Below is a schematic NPS survey for the “Drive Research” product:
The advantage of NPS lies in its simplicity—one question can gauge user loyalty. Yet precisely because it is so simple, applying NPS in practice brings several pitfalls, which we will detail below to help you avoid them.
3 Problems When Applying NPS
Problem 1: The Odd Calculation Method
As mentioned, NPS = % Promoters – % Detractors. This quirky formula can produce scores that are not intuitively reflective of the overall user experience.
Consider three pairs of examples:
Example 1
Product A: 0 Detractors, 2 Passives, 8 Promoters → NPS = 80
Product B: 1 Detractor, 0 Passives, 9 Promoters → NPS = 80
Example 2
Product C: 10 Detractors (all scored 6), 0 Passives, 0 Promoters → NPS = ‑100
Product D: 10 Detractors (all scored 0), 0 Passives, 0 Promoters → NPS = ‑100
Example 3
Product E: 0 Detractors, 10 Passives, 0 Promoters → NPS = 0
Product F: 5 Detractors, 0 Passives, 5 Promoters → NPS = 0
In each pair the two products share the same NPS, yet common sense tells us their user experiences differ dramatically.
Another confusing aspect is calculating the change in NPS. Suppose Product A’s NPS was 50 last month and 100 this month. The absolute increase is 100 – 50 = 50, and the relative change is (100 – 50) / 50 = 100 %.
Because NPS ranges from –100 to 100, negative values make percentage changes counter‑intuitive. For example, if Product B’s NPS moved from –1 to 1, the absolute gain is 1 – (‑1) = +2, and the relative change is (1 – (‑1)) / |‑1| = 200 %.
Feeling bewildered? Wondering if you wasted your math classes? You’re not alone.
Problem 2: The “Hard to Explain” Dilemma
When presenting NPS to product owners, besides “What is NPS? How is it calculated?” three follow‑up questions appear most often:
- Why does my product have this NPS score? Why is it so low/high?
- What can I do to raise the NPS, and by how much?
- What business impact does a higher NPS have? How much will it improve retention or conversion?
Because NPS relies on a single question, it struggles to answer any of these three.
That’s why many apps add follow‑up questions to their NPS surveys. For instance, both Meituan Grocery and Fliggy Travel ask respondents to explain the reason behind their recommendation or lack thereof.

Does adding follow‑up questions fully solve the three issues? Not quite—only partially.
Question 1: Why is my product’s NPS at this level?
— Follow‑up items can give a coarse‑grained insight (e.g., “price” in the Fliggy Travel case), but the fixed‑choice format can’t uncover unknown pain points or drill down to specific screens.
Question 2: What should I do to improve NPS, and by how much?
— With additional questions, you can apply analytical methods that consider satisfaction and importance, prioritizing issues that are “important but have low satisfaction” (see the diagram below). However, predicting the exact NPS lift after fixing an issue remains impossible.
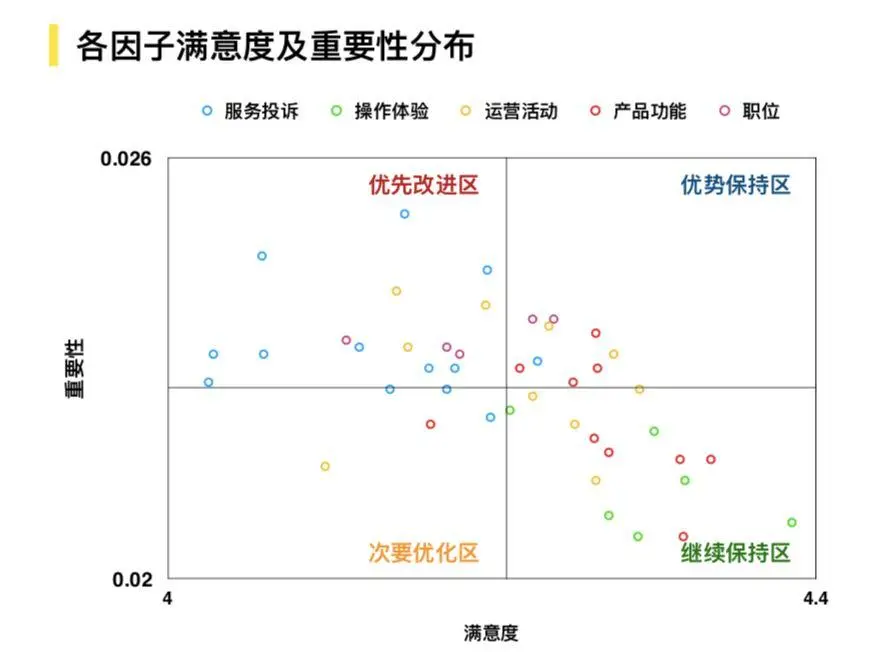
(Image sourced from the internet)
Question 3: What business impact does a higher NPS bring? How much will it boost retention or conversion?
— Follow‑up items still can’t answer this, nor can they forecast the effect. In practice, you might run rigorous A/B tests, but setting those up is complex.
From another angle, if a business uses NPS as the sole metric for product‑feature ROI, it will inevitably hit a wall because NPS is hard to interpret and evaluate.
First, NPS is lagging: it reflects users’ feelings over a past period, and respondents may or may not have experienced a new feature. In real life, a major product change often takes 1–2 months to surface in NPS.
Second, multiple features are usually released simultaneously. Isolating the NPS contribution of a single feature is difficult. A possible solution is a strict A/B test, but that requires tight integration between the A/B testing platform and the NPS survey system at both user‑ and data‑level layers.
Problem 3: High NPS Doesn’t Equal Loyalty, and Loyalty Doesn’t Equal Good Experience
NPS measures the likelihood of recommendation, which is a proxy for loyalty, but it does not guarantee that users will actually recommend. Users may express an intention that differs from their real behavior, and even when they intend to recommend, a gap often exists between intention and action.
Moreover, loyalty is not synonymous with a good experience, because many external factors influence loyalty.
For example, Didi once held a monopoly in the ride‑hailing market; users had little choice but to use it, so its NPS was high, yet that didn’t mean the user experience was great.
Another example: government service apps now allow “online办理” (online processing) instead of visiting a physical office. Their NPS scores are often high, but the overall user experience still has a long way to go.
4 Final Summary
NPS is useful as a high‑level observation and outcome metric for user experience and loyalty. In specific business contexts, it should be complemented with process metrics tied to the business—such as conversion and retention indicators.
When selecting user‑experience metrics, always align them with your business situation. Choose the metric that fits best rather than force‑fitting a mature metric; the right metric is the best metric.
References
- Baidu Baike: NPS https://baike.baidu.com/item/%E5%87%80%E6%8E%A8%E8%8D%90%E5%80%BC/3783368?fromtitle=NPS&fromid=17751327
- Experience Measurement Theory 2021 https://mp.weixin.qq.com/s/qxlNYVMj-Obkcg5xugf2Dg
- Experience Measurement Theory 2019 https://www.yuque.com/docs/share/d1a03cee-9107-49ea-820a-d4fe66deb4a6?%23%20%E3%80%8A5.%20%E4%BD%93%E9%AA%8C%E5%BA%A6%E9%87%8F%E7%90%86%E8%AE%BA%202019%E3%80%8B
WeChat public account: “A Product Dog’s Confession”
Sharing product insights, reflections, and reading notes.
Follow us by scanning the QR code to stay connected.

Originally written by Estela Young and published in Chinese on 一只产品汪的自白. Translated and edited for DriftSeas with permission.
Keywords
Sources & References
- [1]https://baike.baidu.com/item/%E5%87%80%E6%8E%A8%E8%8D%90%E5%80%BC/3783368?fromtitle=NPS&fromid=17751327
- [2]https://mp.weixin.qq.com/s/qxlNYVMj-Obkcg5xugf2Dg
- [3]https://www.yuque.com/docs/share/d1a03cee-9107-49ea-820a-d4fe66deb4a6?%23%20%E3%80%8A5.%20%E4%BD%93%E9%AA%8C%E5%BA%A6%E9%87%8F%E7%90%86%E8%AE%BA%202019%E3%80%8B
- [4]一只产品汪的自白